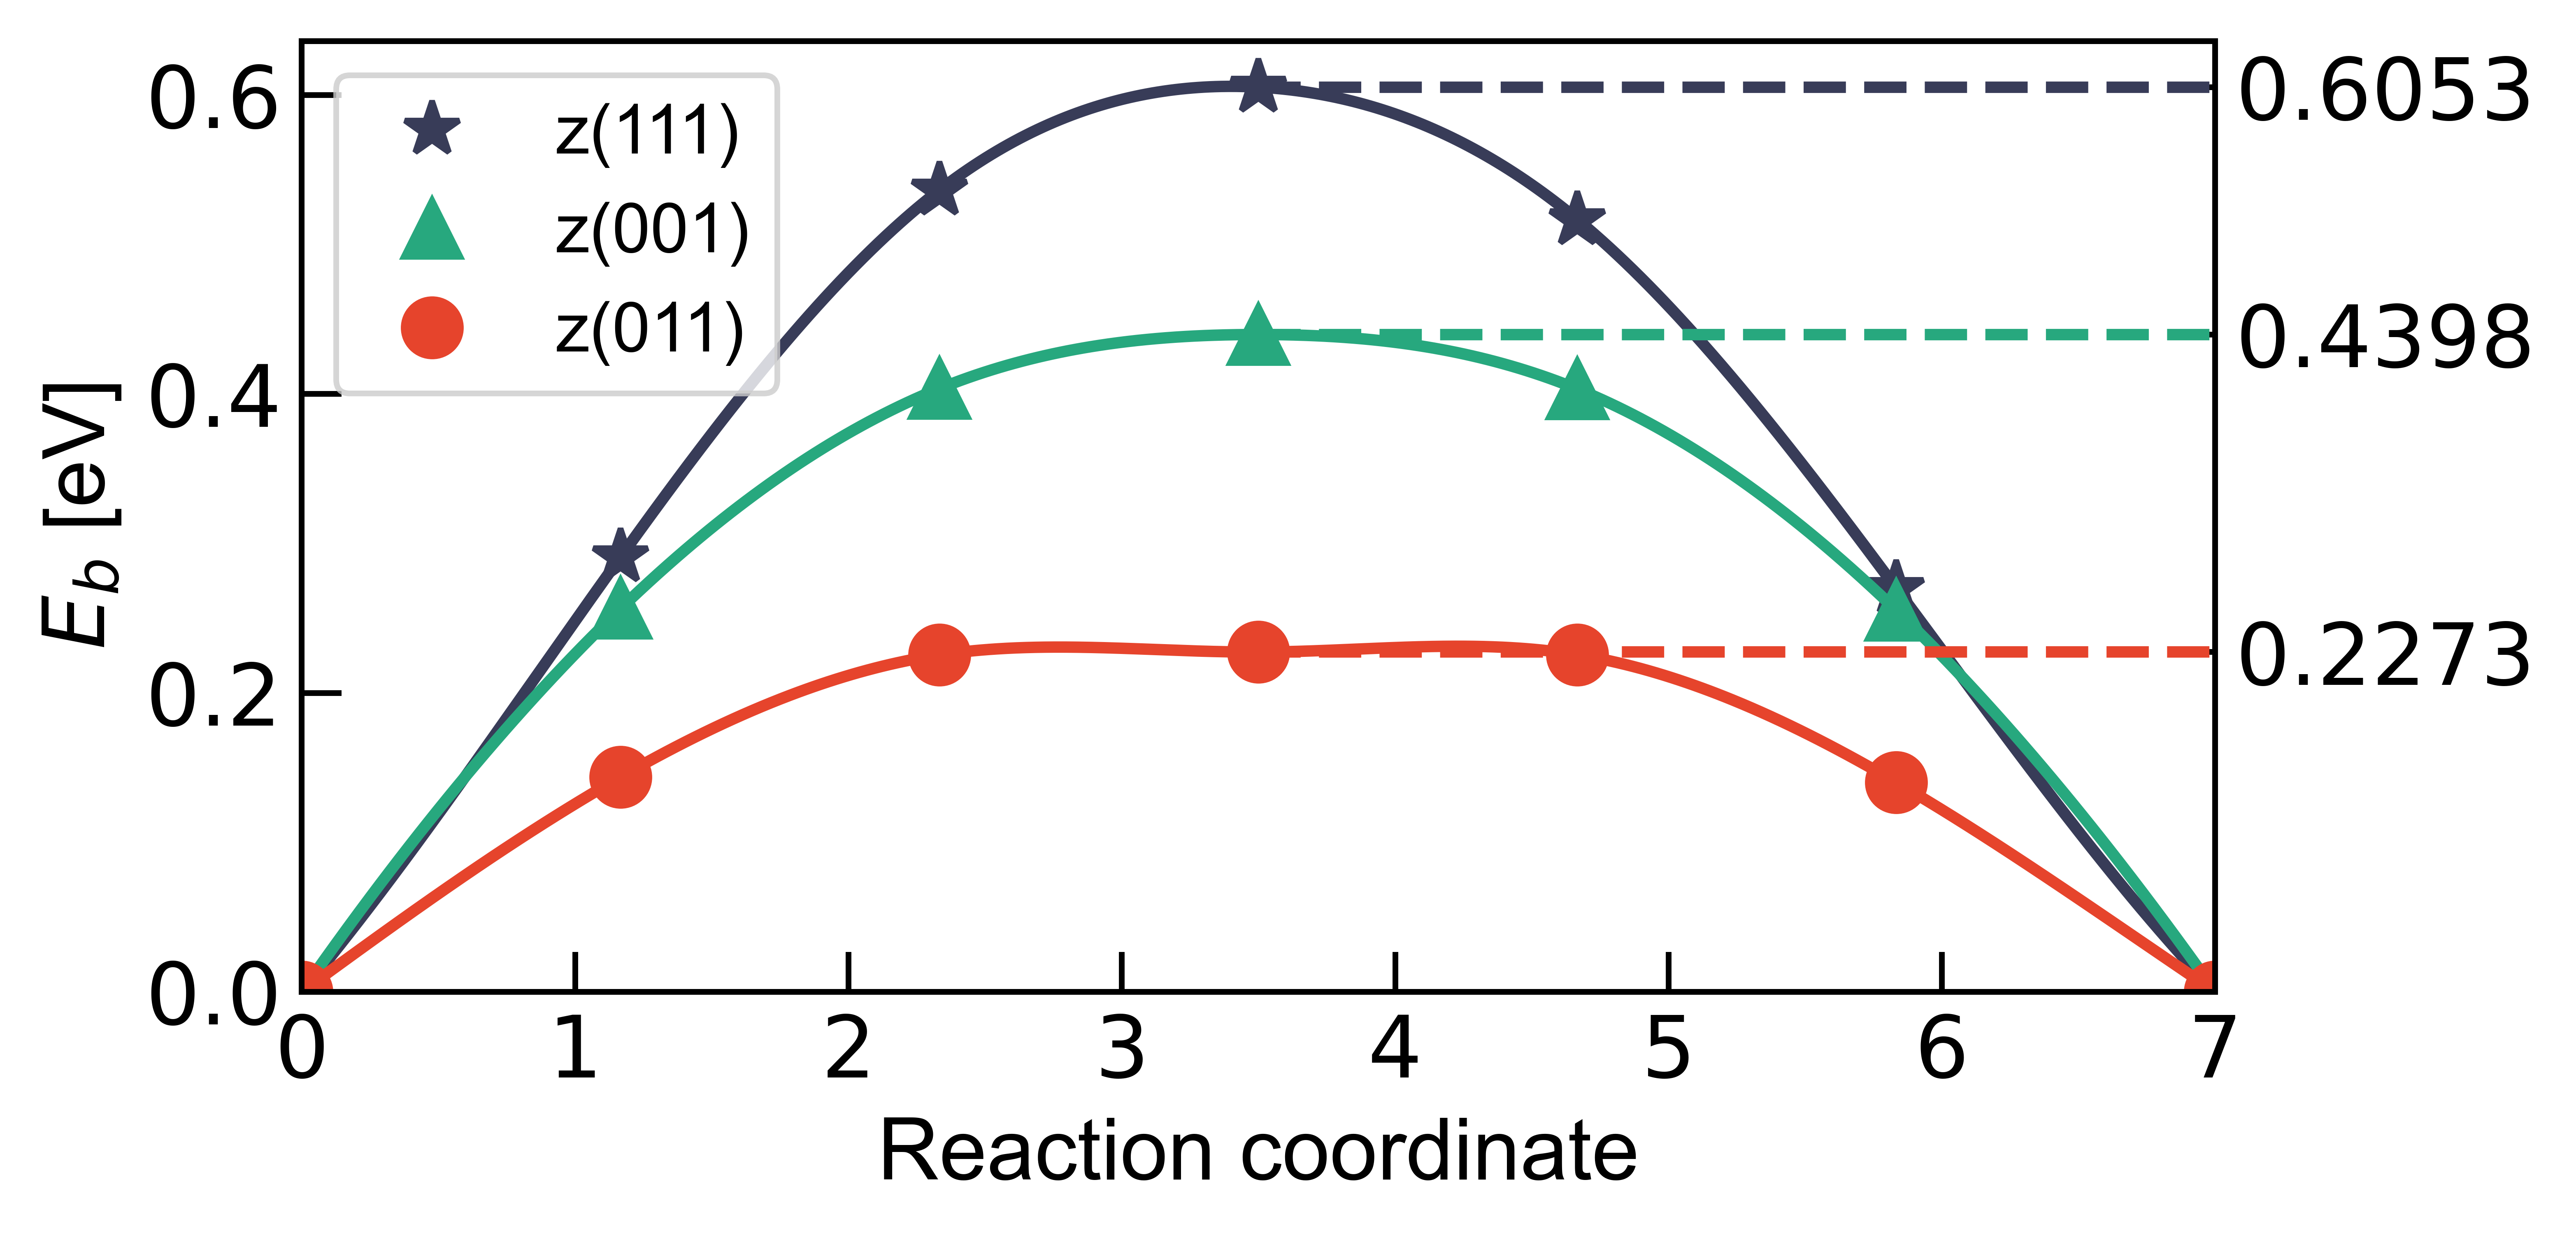
Energy Barrier Plotting
Published:
# -*- coding: utf-8 -*-
# Date 2024Dec27
# =============================

import numpy as np
import matplotlib
import matplotlib.pyplot as plt
from matplotlib.font_manager import FontProperties
from matplotlib.ticker import MultipleLocator
import os
import plotly.graph_objects as go
import scipy as sp

fig = plt.figure(figsize=(6,3), dpi=200)
ax = fig.add_subplot(111)
axx = ax.twinx()
figgo = go.Figure()
plt.style.use("default")
plt.rcParams["lines.linewidth"] = 2
plt.rcParams["axes.linewidth"] = 1
plt.rcParams["xtick.major.width"] = 1
plt.rcParams["ytick.major.width"] = 1
plt.rcParams["xtick.minor.width"] = 1
plt.rcParams["ytick.minor.width"] = 1
font = FontProperties(fname="../arial.ttf", size=12)
colormap = ["#383c58", "#27A87E", "#E6442C"]
markermap = ['*','^','o']

ConvHa2eV = 27.211396132
ConvBohr2Ang = 0.529177

# =========================== need change ========================================
filelist=['','','']     # .path file
labellist=['','','']
# =========================== need change ========================================

energybarrierlist=[]
for file_index, input_file in enumerate(filelist):
    work_dir = input_file[:len(input_file)-input_file[::-1].index('/')]
    input_file = input_file[len(input_file)-input_file[::-1].index('/'):]
    os.chdir(work_dir)

    e = []
    with open(input_file,'r') as f:
        contents = f.readlines()
    for line_index, line in enumerate(contents):
        try:
            line.split().index('Image:')
        except ValueError:
            continue
        except IndexError:
            continue
        linesplit = contents[line_index+1].split()
        e.append(float(linesplit[0]))
    e=np.array(e)*ConvHa2eV             # energy in eV
    e=e-e[0]                            # in energy difference scale
    xx=np.linspace(0,len(e),1000)
    f=sp.interpolate.CubicSpline(np.linspace(0,len(e),len(e)),e)
    ax.plot(np.linspace(0,len(e),len(e)),e,label=labellist[file_index],markerfacecolor=colormap[file_index],markeredgecolor=colormap[file_index],color='none',marker=markermap[file_index],markersize=10)
    ax.plot(xx,f(xx),color=colormap[file_index])

# =========================== arrow and value ========================================
    # ax.annotate('',xy=(len(e)/2,e[int((len(e)-1)/2)]),xytext=(len(e)/2,e[0]-0.008),arrowprops=dict(arrowstyle="<->",linewidth=1.5,color=colormap[0]))
    # energybarrier=e[int((len(e)-1)/2)]-e[0]
    # ax.text(len(e)/2-0.3,e[int((len(e)-1)/2)]/2-0.2,r"  $E_b$="+f"{energybarrier:.4f} eV",fontsize=14,fontproperties=font,rotation='vertical',color=colormap[0])
# =========================== arrow and value ========================================

# =========================== value at right ========================================
    energybarrier=e[int((len(e)-1)/2)]-e[0]
    energybarrierlist.append(energybarrier)
    axx.plot([len(e)/2,len(e)],[e[int((len(e)-1)/2)],e[int((len(e)-1)/2)]],linestyle='--',color=colormap[file_index])
# =========================== value at right ========================================

ax.tick_params(which="major", direction="in", labelsize=15, length=7)
axx.tick_params(which="major", direction="in", labelsize=15, length=7)

axxlabel = "Reaction coordinate"
ax.set_xlabel(axxlabel, fontsize=15, fontproperties=font)
ax.set_xlim([0, len(e)])

axylabel = r"$E_b$ [eV]"
ax.set_ylabel(axylabel, fontsize=15, fontproperties=font)
ax.set_ylim([0,ax.get_ylim()[1]])

ax.legend(prop=font,loc='upper left')

axx.set_ylim(ax.get_ylim())
axx.set_yticks(energybarrierlist)
axx.set_yticklabels(f"{x:.4f}" for x in energybarrierlist)

# fig.savefig('EnergyBarrier.png',transparent='True',bbox_inches='tight')

figgo.add_trace(go.Scatter(x=np.linspace(0,len(e),len(e)),y=e,mode='markers'))
figgo.add_trace(go.Scatter(x=xx,y=f(xx)))
figgo.show()
Output

